Last checked: September 20, 2026
Most payback calculators are only as honest as the numbers you plug in. If you’re building a spreadsheet for an owner-occupied solar install completed in 2026, dropping a 30% federal tax credit into your math makes a quote look great on paper—but it won’t reflect reality. Under Public Law 119-21, Section 25D credits apply based on the date installation finishes, leaving 2026 completion dates with a $0 federal credit.
To get a realistic estimate for a project in Southern Nevada, here is what should belong in your model:
- Out-of-Pocket Cost: The true net price on the check you write to the installer.
- Sales Tax: Clark County sales tax applied to the equipment portion.
- Property Taxes: Under NRS 361.079, the added value of the array shouldn’t trigger an increase in your local property tax assessment.
- Net Metering (NMR-405 Tier 4):
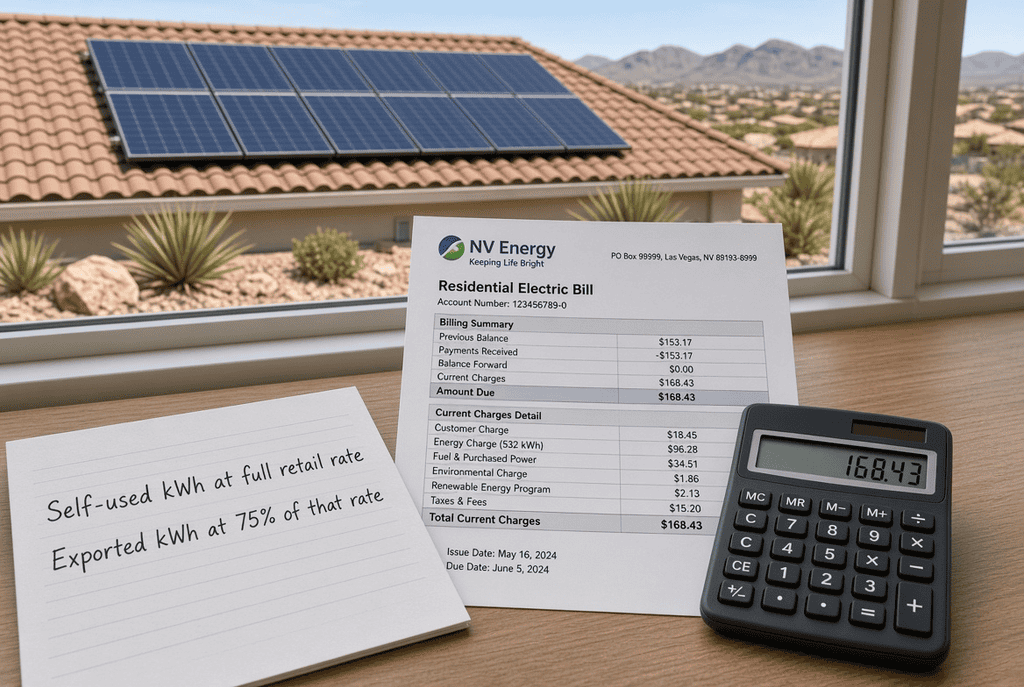
- Power you generate and consume immediately offsets grid power at 100% of the avoided energy rate.
- Unused power exported back to the grid is credited at 75% of the retail rate.
- Your rate structure locks in for 20 years at that specific address, using monthly netting for Southern Nevada customers.
Disclaimer: This is a guide for running your own numbers, not official tax advice or a formal installer bid. Consult a CPA regarding any tax carryforward questions, check NV Energy’s latest rate filings for exact tariff inserts, and use your historical usage data to model expected annual production.
The Only Inputs That Matter
A 2026 payback sheet fails when it’s crowded with dead incentives and empty of your power bill. Keep your spreadsheet small enough to audit easily—if a number doesn’t come straight from your bill, your contract invoice, the NMR-405 tariff page, or Nevada statute, it doesn’t belong in year one. Everything else is just sales fluff.
Here is what belongs in your grid to make the final payback calculation pure arithmetic.
Cost Side
- All-In Contract Price: The total dollar amount on the contract—equipment, labor, permits, interconnection, and sales tax as invoiced.
- Federal Tax Credit: Enter $0 for Section 25D on an owner-occupied system completed after December 31, 2025.
- Sales Tax Check: If sales tax is already factored into the invoice, don’t subtract Nevada’s 8.375% rate a second time.
- Loan Interest: Financing costs belong in a separate expense column, not hidden inside the incentive calculations.
Production Side
- Annual Consumption: 12 consecutive months of NV Energy kWh usage, never a national average.
- Estimated Generation: A site simulation (like PVWatts or your installer’s software) that accounts for your roof’s tilt, azimuth, and shade profile.
- Self-Use Fraction: For a solar-only system in Southern Nevada, 55–70% self-consumption is a common planning baseline (though hourly interval data is always better than a rough guess).
- Exported Power: Any remaining kWh exported back to the grid (Production − Self-Use).
Tariff Side
- Volumetric Energy Rate: Use the specific energy rate in cents per kWh from your current NV Energy rate insert. Don’t use a blended “14¢ all-in” figure that incorrectly bundles the fixed customer charge into the energy rate.
- Export Credit: Set exported energy at 75% of that volumetric energy rate per NMR-405 Tier 4 rules.
- Fixed Charges & Special Rates: The monthly customer charge remains due regardless of generation. If you are on Time-of-Use (6:01–9:00 p.m.) or pay daily demand charges, give them dedicated columns—solar credits cannot offset demand charges.
Tax Side
- Property Tax Exemption (NRS 361.079): The array’s added home value shouldn’t increase your property taxes. Model this as an avoided cost of around $100–$250/year rather than a giant year-one windfall.
- State Income Tax Credit: Leave this blank. Nevada has no state income tax, so there is no state credit cell to fill.
Optional Scenario Controls
- Utility Rate Inflation: Test scenarios at 0%, 2%, and 4% annual increases.
- Inverter Replacement: Include a replacement cost line item if modeling beyond 10–12 years.
- Battery Capex: Include upfront battery costs if adding storage.
- Discount Rate: Only add a discount rate if you are running Net Present Value (NPV) and have a realistic rate to apply.
What Does Not Get a Cell
Leave off dead or non-existent line items like “NV Energy Rebate,” “25% State Credit,” “RETA,” “SREC,” or “30% tax credit if you sign by Friday.” Never mix a lease payment into an owned system’s payback calculation.
Once you strip out the ghost incentives and lock in your true costs, the spreadsheet stops telling a story and simply gives you the real payback year.
Federal ITC in 2026: Almost Always $0
Put zero in the federal credit cell unless you can point to a completed installation date or specific contract terms that say otherwise. For the vast majority of owner-occupied roofs in Nevada completed in 2026, the federal credit simply isn’t an option.
The Default Case: Owned Systems Finished After Dec. 31, 2025
Section 25D (the Residential Clean Energy Credit) is not available for expenditures made after December 31, 2025. Per IRS FAQs under Public Law 119-21, an expenditure is officially treated as made when the original installation is fully completed.
Signing a contract in December and receiving Permission to Operate (PTO) in March makes it a 2026 expenditure. Placing a down payment isn’t completion, either. Your spreadsheet cell value here must be $0. Knocking 30% off a $22,000 system ($6,600) is just a trick installers use to make a 15-year payback look like a 10-year deal.
The Leftover Case: Systems Finished in 2025
If a homeowner finished their installation in 2025, they claim Section 25D on their 2025 tax return. Any unused tax liability can carry forward under the old rules—but that belongs on a separate spreadsheet tab labeled “Already Built.” Don’t let a neighbor’s 2025 tax situation creep into your 2026 quote.
The Third-Party Case: Leases and PPAs
With a lease or Power Purchase Agreement (PPA), you are not the taxpayer owning the array. The leasing company might attempt to claim commercial clean energy credits (Section 48E) based on when they began construction, but whether any of those savings trickle down to your monthly rate is strictly a matter of contract language. Unless the provider explicitly documents a pass-through discount, leave your credit cell at $0 and compare monthly payment schedules rather than banking on phantom credits.
Battery Storage
Adding an owned Powerwall, IQ Battery, or FranklinWH system in 2026 doesn’t magically resurrect Section 25D just because an old blog post said storage was eligible. Batteries change your self-consumption ratio and help optimize Time-of-Use or demand charges, but they won’t refill your tax credit line item.
Who Controls This Cell?
Your CPA owns this tax determination, not a solar salesperson. A quote sheet is not an official IRS Form 5695. If a sales proposal and your tax advisor disagree, the Internal Revenue Code wins every time.
The Quote Test
Take a highlighter to the ITC line on your proposal. If it shows a 30% federal credit for an owned system completed in 2026, the rest of the payback projection is pure theater. Send the quote back for recalculation before you even bother discussing solar panel brands.
Ultimately, owned solar in Nevada in 2026 is a full-price asset that relies on utility tariffs and state property tax exemptions to pay for itself. The federal residential credit is no longer part of that equation. Model it at $0, or stop calling your spreadsheet a 2026 calculator.
For more details about solar savings and regulations, explore our 2026 guides on a case study about the before & after installing an 8kW system, the net metering 15-minute billing update, and a complete 2026 solar incentives guide.
Nevada Tax Exemptions in the Spreadsheet
Two local tax rules still belong in a 2026 financial model—and neither one is a 30% federal credit wearing a cowboy hat.
Sales Tax: Handle It Once on the Invoice
Clark County’s combined sales tax rate sits at about 8.375%. Many residential installers don’t charge sales tax on qualifying solar equipment.
- If tax shows $0 on your contract: That net dollar amount is your cost. Do not subtract another 8.375% in the sheet.
- If tax appears on your invoice: Leave it in the baseline cost unless the installer cites the Nevada statute or Department of Taxation ruling they are using. Do not invent a removal.
Don’t confuse this with the Renewable Energy Tax Abatement (RETA). RETA is a partial tax abatement reserved for utility-scale facilities (10-megawatt projects with strict job and wage requirements). An 8 kW residential roof isn’t Southern Bighorn, so RETA doesn’t apply.
Property Tax: NRS 361.079 is Annual and Modest
Nevada doesn’t assess property taxes directly on “Zillow market values.” Assessed value is calculated as 35% of the taxable value. In Clark County, combined tax rates generally range from $2.70 to $3.28 per $100 of assessed value depending on the municipality, making the effective tax rate on market value roughly 0.5% to 0.7%.
Under NRS 361.079, a qualified residential renewable energy installation is exempt from property tax assessments. The array’s added value won’t raise your annual tax bill the way building a pool house or room addition would.
The Planning Math:
- If your solar installation adds $20,000 in market value, avoiding a ~0.6% effective tax levy saves you roughly $120 a year.
- Even a $25,000 addition at the higher end of the tax spectrum saves only a few hundred dollars annually—it isn’t a $7,000 year-one “incentive check.”
Model this as a conservative $100 to $250 per year in avoided property tax costs (and verify the specifics with the Clark County Assessor).
What Does Not Get a Cell
Leave off non-existent items like state income tax credits (Nevada has no state income tax), federal 25D credits for owner-occupied systems completed in 2026, property-tax rebate checks, or capital-gains theater.
How to Input These Numbers
- Cost Row: Use the total installed cost after accounting for sales tax on the invoice.
- Annual Savings Row: Add your utility energy savings to the small annual property tax savings ($100–$250/yr).
Avoid multiplying 20 years of property tax savings (e.g., $180 × 20 = $3,600) and subtracting it from your year-one upfront cost unless you are calculating Net Present Value (NPV) and explicitly setting a discount rate. At the end of the day, Nevada’s remaining tax benefits come down to simple invoice hygiene and an avoided property tax bump. Together, they save a few thousand dollars over two decades, but they won’t make up for a missing $6,600 federal tax credit—so enter them accurately, or your spreadsheet is just a quieter version of a sales flyer.

Energy Savings: 100% Self-Use + 75% Export
This is the only savings engine that continues running on your monthly utility bill. Get these two categories right, or any payback projection you calculate will be fiction.
The Baseline Formula
Year-1 Energy Savings ≈ (Self-Used kWh × Volumetric Energy Rate) + (Exported kWh × Volumetric Energy Rate × 0.75)
Use the volumetric energy rate in cents per kilowatt-hour from your utility rate insert, not an “all-in blended average” that hides the fixed basic service charge. You still have to pay that fixed charge every month regardless of your solar output, and solar credits cannot offset it. Mandated public-policy fees carved out of the credit calculations also remain excluded.
Self-Used Power: The 100% Product
Midday electricity generated by your panels that immediately runs your air conditioner never hits the grid as an export. It directly offsets a full-price retail power purchase.
Increasing your self-consumption ratio shortens your payback period without requiring you to buy extra solar panels:
- Operational Shift: Running midday laundry, pre-cooling your home between 3:00 p.m. and 5:00 p.m., or charging an electric vehicle outside of dinner hours generates extra value from your system.
- Storage Impact: Adding a home battery set to self-consumption mode turns 75% export credits into 100% avoided energy purchases later in the evening—though you have to balance those energy savings against the upfront equipment cost.
Exported Power: The 75% Product
Under Southern Nevada’s Net Metering rules (NMR-405 Tier 4), any excess energy remaining after monthly netting is credited at 75% of the volumetric rate. Oversizing an array just to hit maximum capacity limits often results in giving away a quarter of every extra midday kilowatt-hour generated. (In Northern Nevada under NMR-2025, exported power is also credited at 75%, but calculated in 15-minute intervals rather than monthly netting).
A Practical Planning Example
Consider an 8 kW system producing roughly 12,000 kWh per year:
At 60% Self-Use:
- Self-Use: 7,200 kWh × $0.12 = $864
- Export: 4,800 kWh × $0.09 = $432
- Total Estimated Energy Savings: $1,296/year
At 70% Self-Use:
- Self-Use: 8,400 kWh × $0.12 = $1,008
- Export: 3,600 kWh × $0.09 = $324
- Total Estimated Energy Savings: $1,332/year
The exact same roof with smarter energy consumption delivers higher annual returns. Note that extreme desert heat and dust buildup reduce solar output; a 10% production drop knocks roughly $130 off this example, making regular panel washing worthwhile.
What This Calculation Excludes
Do not bundle the following into your general energy savings line item:
- Demand Charge Savings: Requires a dedicated kW demand tracking column.
- Time-of-Use (TOU) Peak Savings: Only applies if you actively schedule loads or use battery storage during peak windows.
- Fixed Utility Customer Charges: Cannot be wiped out by energy generation.
- Vague Estimates: Ignore flat “$200/month savings” estimates printed on sales fliers.
To keep your spreadsheet honest, enter two core values: power consumed directly at home, and leftover power multiplied by 0.75. If a proposal simply multiplies total estimated production by the full retail electricity rate, it is crediting exported power at 100% instead of its 75% value. Correct those power categories before evaluating your estimated payback timeline.
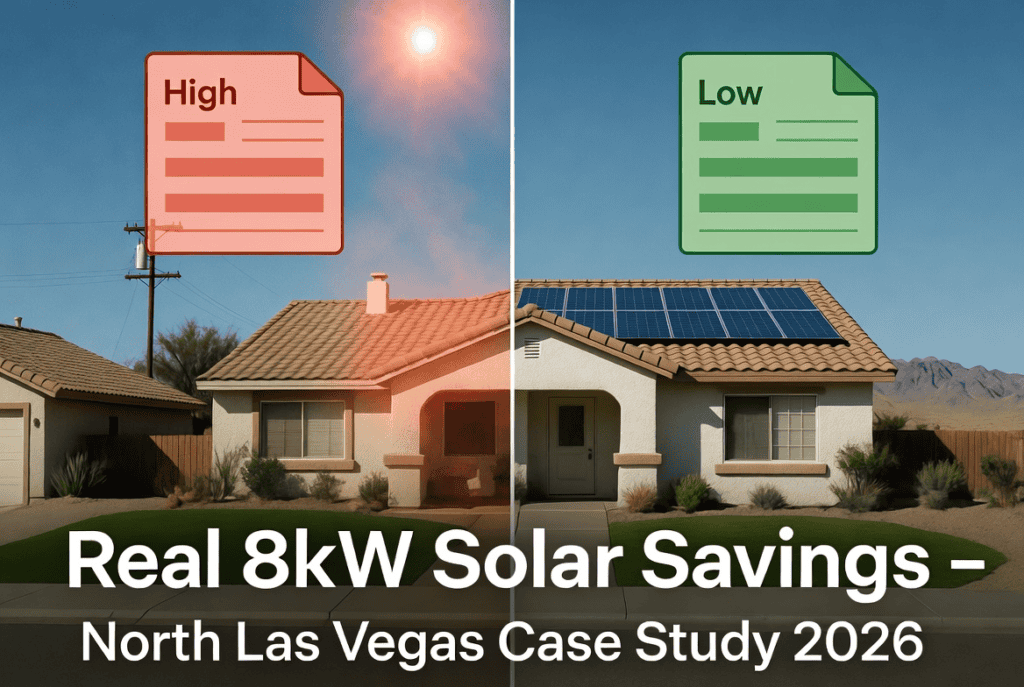
Real-World Solar Math: An 8 kW Roof in North Las Vegas
(Teaching template only—swap in your contract numbers and utility bills when running your own math.)
The Baseline Setup
Imagine an 8 kW system installed on a good, sunny roof angle:
- Upfront Cost: $22,000 all-in (assuming $0 federal tax credit under Section 25D, and no equipment sales tax on the invoice).
- Annual Output: Around 12,000 kWh per year.
- Usage Split: 60% of the energy is used in the home directly; 40% is exported back to the grid.
- Utility Rates: You pay $0.12/kWh for power you pull from the grid. The power company buys your exported solar power back at a 75% rate ($0.09/kWh).
- Property Tax Perk: $180/year in property tax exemptions.
- System Design: Standard flat-rate power, no home battery yet, ignoring the base customer charge since you pay that whether you have solar or not.
Year 1: What You Save
- Power used at home: 7,200 kWh × $0.12 = $864
- Power sent to grid: 4,800 kWh × $0.09 = $432
- Energy Subtotal: $1,296
- Plus Tax Exemption: +$180
- Total Year 1 Savings: $1,476
Dividing the $22,000 upfront cost by that $1,476 annual savings gives you a simple payback of ~14.9 years—call it 15. For an owned 8 kW system in North Las Vegas, a realistic timeline almost always sits in this low-to-mid teens range; hitting single digits only happens if your power bills are massive, your direct self-use is exceptionally high, or utility rates jump sharply.
Shift Your Habits, Shift the Payback
What happens if you bump your direct self-use up to 70% just by running heavy appliances during the day?
- 8,400 kWh self-use × $0.12 + 3,600 kWh export × $0.09 = $1,332
- Add the $180 tax break = $1,512/year
- New Payback: ~14.5 years
It’s not a miracle shortcut—it’s roughly the difference of timing your dishwasher while the sun is up.
The “Ghost” Proposal Problem
If a salesperson hands you a flyer promising a 10-year payback, check the tax line.
Under the old 30% federal tax credit, that $22,000 system dropped to $15,400 net ($15,400 ÷ $1,476 = 10.4 years). The panels don’t produce any less energy today than they used to—the tax credit line on the quote just changed. That outdated calculation is still floating around on door-to-door flyers, which is why printing a realistic 15-year estimate next to any 10-year pitch is so essential. That gap tells you the whole story.
What Happens When You Add a Battery?
Adding a battery unit bumps total upfront capex by about $14,000, bringing the total cost to $36,000.
- If Time-of-Use (TOU) rates and demand shaving save you an extra $400/year, your total annual savings rise to $1,876.
- New Payback: ~19 years.
It lengthens the payback calendar, but changes the shape of your electric bill and gives you blackout backup power. Just make sure the upfront cost isn’t hidden in the pitch.
6 Things That Ruin the Math
- Inverter Overheating: A hot, west-facing wall can cause inverter derating.
- Dirty Panels: Dust and grime drop output by ~10% (a ~$130 loss every year).
- Oversizing the System: Upsizing to 12 kW leaves you selling back huge amounts of energy for lower-value export credits.
- Unmanaged Peak Hours: Switching to TOU rates and running the AC at 6:20 p.m.
- Demand Charges: Added utility demand lines that solar credits won’t cover.
- Financing Interest: Loan interest fees if you finance instead of paying cash.
How Changing 4 Key Knobs Moves Your Solar Payback Timeline
A simple payback calculation gives you a single snapshot under ideal conditions. But in the real world, shifting just a few variables can quickly move that timeline in either direction. That isn’t a reason to rely on outdated tax credits to make the numbers look better—it’s a reason to run realistic scenarios.
1. Utility Rate Inflation
If local energy rates stay completely flat, our standard 8 kW example lands right around a 15-year payback.
If utility rates rise by 2% per year, those later years of savings compound, pulling your overall break-even date forward. If rates inflate at 4% per year, the financial return starts looking much more aggressive.
When planning, it helps to look at 0%, 2%, and 4% rate inflation side by side as three separate columns. Avoid using extreme 6%+ inflation estimates just to make a proposal look attractive; historical utility rate changes are a helpful guide, not a guarantee.
2. Time-of-Use (TOU) Rates
(Peak Hours: 6:01 p.m.–9:00 p.m., June–September)
If your central air conditioning runs heavily during summer peak hours, you’re buying expensive power right as solar generation fades for the day. Under a TOU plan, a solar-only system can worsen your payback period compared to a standard flat rate.
- Behavioral Fix: Pre-cooling your home between 3:00 p.m. and 5:00 p.m. and shifting laundry to off-peak hours offers moderate bill relief.
- Hardware Fix: A dedicated home battery is the primary tool that actively targets and reduces high-cost evening rate spikes.
Always model your energy usage under both flat and TOU schedules before committing to a rate plan change.
3. Daily Demand Charges
When utility billing includes a demand charge, standard energy credits can’t offset it. For example, a home that consistently spikes to a 6 kW load at 6:20 p.m. on hot July days adds a separate demand line to the bill that solar panels alone rarely reduce.
Start by staggering high-power appliance usage to smooth out consumption spikes. After that, evaluate whether a battery storage system dedicated to peak shaving is necessary to control those charges. Any solar evaluation that ignores active demand structures is relying on an outdated playbook.
4. Battery Equipment Costs (Capex)
Adding a home battery typically adds $10,000 to $20,000+ in upfront costs. A battery operates as a secondary asset that can increase direct solar self-use, trim TOU peak costs, shave demand charges, and provide emergency backup power.
However, because a modest annual savings increase of $300–$800 is applied against a significantly higher starting cost, adding storage will often extend your simple payback period. To evaluate this clearly:
- Look at Solar-Only as line item one.
- Look at Solar + Storage as line item two.
- Treat the peace of mind from emergency backup power as a valuable separate feature, rather than trying to measure it solely in energy savings.
Real-World Production Haircuts
System performance can drop by roughly 10% due to intense heat, dust and silt buildup, or thermal derating from an inverter mounted on a hot, sun-exposed west wall. A 10% dip in output reduces both your direct energy savings and your utility export credits by 10%. Regular panel washing and smart equipment placement are simple adjustments that directly protect your system’s output.
A realistic 15-year base case for an owned system can shift to 12 years under higher utility bills and rising rates—or push out to 18 years if you add demand charges, a TOU plan, and an upfront battery cabinet purchased primarily for backup power.
Presenting a clear range of outcomes provides a much truer picture than relying on a single fixed payback date.

Keeping Financial Models Clean in Separate Tabs: Leases, PPAs, and Prior-Year Credits
When analyzing solar economics, it is essential to keep distinct financing structures and tax scenarios completely separate. Blending different ownership models into a single cash flow column creates a false impression of current pricing and available credits.
Tab A: 2026 Cash or Financed Purchase (Current Baseline)
- Net Investment: The full contract price (accounting for local sales tax treatment).
- Federal Tax Credit: $0 (assuming no Section 25D availability).
- Annual Value: Direct bill savings from self-consumed power, utility credits from exported generation, and any local incentives or tax exemptions.
This reflects the economics of buying a system today. It serves as your primary benchmark against standard utility bills.
Tab B: Prior-Year Owned Systems (Legacy Tax Credits)
Systems installed and commissioned in prior years may have qualified for the federal Section 25D residential solar credit, including any available tax carryforwards.
- Tax Treatment: Managed directly through IRS filings by a qualified CPA.
- Economic Reality: A legacy system’s payback period reflects a tax incentive that is no longer available to new buyers today.
Comparing a new 2026 proposal against a neighbor’s 2025 system creates an inaccurate baseline. Keep all historical or carryforward tax scenarios strictly labeled as “Prior Year.”
Tab C: Leases & Power Purchase Agreements (PPAs)
With a lease or PPA, you do not own the physical equipment. Instead, you commit to a monthly payment structure, annual escalator clauses, a fixed term, and potential end-of-term buyout options.
- Third-Party Credits: The installer or solar company may utilize commercial tax credits (such as Section 48E) on their end, but whether those savings translate to a lower monthly rate depends entirely on the contract terms.
- Financial Evaluation: Compare total lifetime expenditure—including all monthly payments, escalators, and potential buyout fees—against the cash or loan model in Tab A.
Never input third-party commercial tax credits into the residential ITC cell for an owned system.
Why Blending Financial Models Causes Errors
- Prepaid Leases vs. Cash Purchases: A prepaid or heavily discounted lease using commercial credits may show lower Year 1 costs than a direct purchase. However, if annual price escalators are built in, the cumulative expense can surpass an owned system over time.
- Legacy vs. Current Purchases: An owned system installed under former tax credit rules will naturally show a shorter simple payback period than an identical system purchased today under current rules—regardless of contractor pricing or equipment quality.
Inheriting Solar on a Home Purchase
When buying a home with an existing solar installation, always verify which financial model you are acquiring:
- Net Metering Status: Confirm which utility rate schedule and export credit tier the property is locked into.
- Tax Credit Ownership: The utility rate agreement remains attached to the property, but any previous federal tax credits remained with the taxpayer who originally installed the system.
Clear financial modeling requires distinct tabs for Current Owned, Prior-Year Owned, and Lease/PPA structures. The physical performance of the solar panels may remain the same, but the financial model changes entirely based on how the system is financed and billed. Every clear proposal should explicitly state which model it uses.
How to Build Your Own Solar Spreadsheet
You don’t need expensive software to run an accurate solar financial analysis. A basic spreadsheet and a refusal to plug in outdated 30% tax credits will give you everything you need.
Setting Up Your Columns
Row 0: The Net Cost (Your Baseline)
Start with the total installed price directly from your contract. Account for any sales tax treatment (which is often $0 on solar equipment) and set the federal Section 25D credit line to $0. This final number is your financial break-even target.
Column A: Years 1 through 25
List your timeline using standard integers from Year 1 to Year 25.
Column B: Energy Savings
- Year 1: Calculate your savings using the formula:
(Direct Home Self-Use kWh × Local Electricity Rate) + (Exported kWh × Utility Export Rate) - Years 2–25: Scale Year 1 savings over time using a rate inflation factor:
Year 1 Savings × (1 + Rate Inflation)^(Year – 1)
Run three separate variations using 0%, 2%, and 4% inflation rates. For extra precision, you can apply a standard annual panel degradation factor of ~0.4% to decrease production slightly each year.
Column C: Property Tax Exemptions
Include any annual property tax exemption values (typically $100–$250 depending on local rates). This can remain flat or grow slightly over time.
Column D: Demand Charges & Time-of-Use (TOU) Adjustments
- Positive Value: If a battery or behavioral load-shifting saves money on TOU peak rates or demand charges.
- Negative Value: If unmanaged TOU hours or live demand charges increase costs that solar export credits cannot cover.
- Zero: If you are on a standard flat residential rate with no active demand charges.
Column E: Future Capital Expenses (Capex)
Factor in future maintenance or component replacements, such as an inverter swap around Year 12 (if not covered by an extended warranty) or a battery replacement down the line. If you choose not to estimate future repairs, leave this at $0 and note it as an exclusion.
Column F: Net Annual Cash Flow
Calculate total annual savings using the formula:
Column B (Energy Savings) + Column C (Tax Exemption) + Column D (TOU/Demand) – Column E (Capex)
Column G: Cumulative Cash Flow
Track the running total of your annual net savings starting from Year 1 and compare it against your initial Row 0 Net Cost. Your simple payback period is the exact year Column G equals or exceeds Row 0. Highlight that row.
| Column / Row | Name | Calculation / Source |
| Row 0 | Net Cost | Total Installed Contract Price (Minus real credits, plus sales tax) |
| Column A | Year | Integers 1 through 25 |
| Column B | Energy Savings | (Self-Use kWh × Rate) + (Export kWh × Export Rate) × (1 + Inflation)^(Year-1) |
| Column C | Tax Exemptions | Annual property tax credit ($100–$250) |
| Column D | TOU / Demand | Savings (+) or added costs (-) from peak rates and demand lines |
| Column E | Capex Later | Inverter replacement (~Year 12) or battery swap costs |
| Column F | Net Annual | Column B + Column C + Column D – Column E |
| Column G | Cumulative | Running sum of Column F (Break-even when Column G ≥ Row 0) |
Quick Reference: Spreadsheet LayoutRecommended Scenario Setup
To get a comprehensive look at your investment, build models for:
- Utility Rate Inflation: 0%, 2%, and 4% rate growth.
- System Configurations: Solar-Only vs. Solar + Storage.
- Ownership Models: Owned System (Cash/Loan) vs. Lease/PPA (analyzed in a separate file).
Comparing these scenarios side-by-side gives you a realistic view of how your returns will perform across different economic conditions.
Quick Audit Checks for Errors
1. Retail Export Error: Is your Year 1 savings higher than your entire previous annual electric bill? You likely calculated exported power at full retail utility rates instead of reduced export credit rates.
2. Tax Credit Phantom: Is simple payback showing ~8 years for an owned 2026 system with average energy use? Check if a 30% federal tax credit was accidentally included in the math.
3. Missing Demand Line: Are demand charges active on your rate plan, but Column D is $0? The analysis is incomplete and needs TOU/demand adjustments factored in.
Building this table creates a clear boundary around your solar proposal. Populating Row 0 and Column B using the installer’s production estimate alongside your actual energy bills provides a solid foundation for evaluating a quote. If an installer is unwilling to walk through these specific inputs with you, they are offering a marketing brochure rather than a transparent estimate.
Final Advice: Evaluating Your Nevada Solar Math
A reliable 2026 Nevada payback calculator is a straightforward grid governed by one strict rule: the federal Section 25D residential tax credit is $0 for new owner-occupied installations. Enter that zero first; otherwise, you are calculating returns based on outdated 2024 marketing rules.
Inputs to Include
When setting up your financial model, make sure you enter:
- Full Installed Cost: The true contract price including all applicable sales tax treatment on equipment as invoiced.
- Direct Self-Use Savings: Energy consumed directly at home valued at 100% of your volumetric utility rate per kWh.
- Exported Energy Credits: Excess solar sent back to the grid credited at the established 75% rate.
- Property Tax Adjustments: The standard property tax exemption (NRS 361.079), which adds modest annual value (typically a couple hundred dollars a year, not thousands in Year 1).
- Time-of-Use & Demand Lines: Separate columns for TOU rate changes or active demand charges whenever applicable.
(Note: Remember that basic monthly utility customer charges still apply whether you have solar or not, so keep them separate from your energy savings).
Inputs to Exclude
Do not include any of the following non-applicable or phantom credits in a current owned-system model:
- The former 30% Residential ITC (Section 25D).
- Non-existent state income tax credits or utility rebates.
- Renewable Energy Tax Adjustments (RETA).
- Lease or PPA payments disguised as cash-purchase energy savings.
- Legacy 2025 tax carryforwards claimed by a neighbor on a prior tax return.
How to Interpret the Timeline
For a standard 8 kW roof in North Las Vegas using realistic planning rates, simple payback typically lands in the low-to-mid teens (years).
- High Single-Digit Payback: Requires a large electric bill, exceptionally high daytime energy use, and aggressive utility rate increases.
- 18–19 Year Payback: Common when adding a home battery cabinet evaluated strictly on utility kWh savings rather than backup power value.
Always model and view the full range of outcomes. Nevada’s solar resource remains outstanding—only the federal Treasury check has changed.
Maintain Three Separate Models
Never blend different financial setups into a single analysis:
- Current Owned System (2026 Baseline)
- Prior-Year Owned System (Legacy Tax Credits)
- Lease or PPA Structure (Third-Party Ownership)
Combining these scenarios is the primary way an unrealistic “10-year payback” gets re-engineered into modern quotes.
A solar calculator isn’t just a sales tool—it is a method to ensure a proposal doesn’t rely on obsolete tax law. Set your baseline contract cost in Row 0, calculate your net energy credits in Column B using current utility rate structures, and make your decision based on transparent numbers.
Thank you for reading! If you have any feedback or a specific Nevada solar topic you’d like us to cover next, please reach out directly at admin@nevadasolarguide.com.