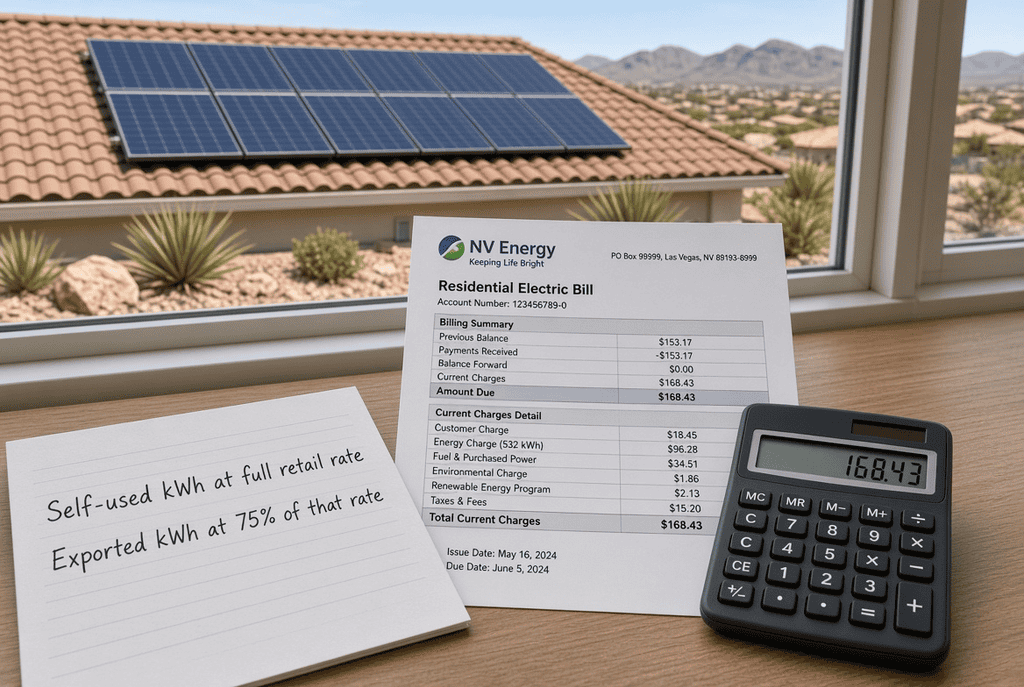
This case study uses a realistic composite household in Las Vegas / North Las Vegas—it isn’t a named family, and it isn’t a guarantee. The kWh figures, the 8 kW system, and the NMR-405 rules reflect what appears on real local roofs in 2026. The main lesson applies to every honest quote: solar reduces your energy charges, but it doesn’t eliminate your basic service charge. Excess power you send back to the grid is credited at 75%. Also, the federal 30% Section 25D tax credit is no longer available for new owner-occupied systems completed after December 31, 2025. If a before-and-after graphic relies on that credit to look strong, it’s using outdated numbers.
Note: To keep up with fast-moving solar trends in Nevada, I use AI tools to help with research and writing. Every post is personally reviewed and edited by me.
Meet the Homeowner: A Typical North Las Vegas Household
This household is a composite that reflects the typical load shape of many 1,800 to 2,000 sq ft homes in the Valley. It is not a named family, and it is not a prediction for any specific roof.
The House
Stucco walls, a tile roof, a two-car garage, a 4-ton split system, and ducts that have seen a few Julys. The household includes two adults, school-age kids, and someone home by late afternoon. The thermostat sits at 74°F when it’s 108°F outside—exactly the kind of habit that produces 2,000+ kWh months. There is no whole-home battery yet. One sedan sits in the driveway; an EV is treated as a “what if” scenario rather than part of the baseline. The pool pump is off in the base case and only appears in the scenario analysis.
The Bill Shape
Annual consumption runs about 14,500 kWh/year. Winter is quiet—700 to 900 kWh months that look like any mild-climate house while April and October are the mild months. July and August are where the story lives: 2,100 to 2,200 kWh if the compressor never gets a setback. That creates a $280 to $340 monthly statement band once energy charges and basic customer fees land. The annual total sits near $2,100 to $2,300 before solar—with energy making up the majority of it, and basic fees forming the part solar cannot erase.
The Tariff They Are On
The household starts on standard southern residential energy service, not optional Time-of-Use (TOU). That distinction matters. Switching to 6:01–9:00 p.m. on-peak rates without a battery would reprice the exact hours the air conditioner is still on at full power. They will own the array, which is why the “after” column keeps the Section 25D credit at $0.
Why 8 kW Fits This File
Fourteen-and-a-half thousand kWh is more than a 6 kW system can reasonably cover, but less than a 12 kW “export farm.” An 8 kW array producing roughly 12,000 kWh still leaves a gap the house buys on July nights and creates a surplus it exports in April. That combination of shortfall and surplus is the core NMR-405 story. You have to size to the load before you size the modules: this composite is a heavy-but-normal North Las Vegas summer house on standard residential rates, an owned roof, and no ITC. If your usage is lighter, the payback improves.
What Would Change the Composite
A pool pump running through dinner. Work-from-home servers. A second freezer. A west-facing roof. A household that already keeps the thermostat at 78°F. Those homes need their own twelve months of bills analyzed, not this paragraph. And if your profile includes a pool and time-of-use rates, keep reading—those “after” bills will not look like $18.
For more details about solar savings and regulations, explore our 2026 guides on the net metering 15-minute billing update, a 2026 solar incentives guide, and an explanation of NV Energy net metering.
The 8kW Solar System Installed
Eight kilowatts is a target capacity, not a brand. In this composite, it means enough panels to handle most of the 14,500-kWh annual usage without turning the roof into a 75% credit factory.
The Array Layout
The ideal layout uses a south-to-southwest tile roof with two stories of clear afternoon sun and little shading from vent pipes. That works out to roughly twenty 400W-class modules—Qcells Q.TRON or REC Alpha Series if the quote uses solid hardware, rather than leftover commodity PERC panels with inflated nameplate wattage. The racking, rails, and flashings need to be rated for high desert wind loads and local clay tile. Those details matter for durability, but for this analysis we’re focused on the system’s generation capacity.
Inverters and Power Conversion
Whether you use Enphase IQ8 microinverters, a SolarEdge Home Hub with optimizers, or a Tesla hybrid string inverter, pick one reliable ecosystem and mount the equipment on a north-facing or shaded exterior wall. Putting a solar hub on a hot western wall turns it into a skillet that can cause thermal derating right around 4 p.m., undercutting late-afternoon production. Module-level monitoring is also essential so you can spot a single dirty or underperforming panel during peak summer output.
The Interconnection Paperwork
An NSCB C-2 licensed electrical contractor handles the permitting, PowerClerk filing, and utility inspection to secure final Permission to Operate (PTO). That locks in the NMR-405 Tier 4 rider on your interconnection agreement, guaranteeing a monthly 75% export credit rate for 20 years at this address. Expect an installed price of around $22,000 all-in for an owned system in 2026, with sales tax as invoiced (often $0 on local solar equipment). There is $0 from the Section 25D federal tax credit and no utility rebate.
Expected Annual Production
An 8 kW system on a good roof plane in the Las Vegas Valley generally produces around 12,000 kWh per year before accounting for intense heat and desert dust. That works out to a solid yield of about 1,500 kWh per installed kilowatt, though it is not magic. After factoring in high-temperature efficiency losses and a dusty June, a realistic range sits between 11,000 and 12,000 kWh annually. Regular panel washing is simply part of keeping the system running well.
System Sizing Boundaries
An 8 kW residential system is not a 25 kW commercial export plant, a whole-home backup solution, or a complete answer for both a pool pump and an EV. It is also not a reason to ignore load shifting. Oversizing the array to 11 or 12 kW just “so July dies” mostly creates extra 9¢ export credits once the home’s midday demand is already covered.
Why It Fits This Profile
Generating 12,000 kWh against a 14,500 kWh annual household load leaves a manageable gap you still buy from the grid after sunset, along with a modest surplus you export in April. That balance of shortfall and surplus is the core of the before-and-after picture: it produces much smaller July bills rather than a magical $0 statement.

After Solar: Real Monthly & Annual Savings
Getting Permission to Operate (PTO) doesn’t suddenly drop your monthly utility bill to $18. It changes the kWh consumption column while leaving the standard fees in place.
The Annual Energy Math
An 8 kW system produces roughly 12,000 kWh per year. Assuming a 60% self-consumption rate, you directly avoid buying 7,200 kWh at the standard retail rate (7,200 kWh × $0.12 = $864 saved). The remaining 4,800 kWh of surplus is exported at the 75% net metering credit rate (4,800 kWh × $0.09 = $432 earned). That brings total energy savings to about $1,296 per year. You can add another $100 to $250 if you include the property tax exemption, but do not include the Section 25D federal tax credit or any nonexistent utility rebates.
What July Looks Like After Solar
Solar production peaks around noon and drops off by 6:20 p.m. Monthly netting lets spring credits generated in the same billing cycle offset later usage, but a heavy 2,200 kWh July load combined with fading late-afternoon generation means you will still import power after dinner. Seeing a typical $300 summer bill drop to $80–$140 plus fixed fees is a realistic post-solar outcome. A $18 July bill requires an AC setpoint of 78°F, aggressive pre-cooling, and mild summer weather—or a sales flyer.
What January Looks Like After Solar
Winter brings low home energy demand and solid sun exposure on clear desert roofs. Solar production can cover nearly all of your monthly consumption during this period. As a result, the winter bill often lands right at the basic customer charge floor—roughly twenty-something dollars for the connection cost plus minor local fees, which is a successful outcome, even if it is not $0.
The Realistic Annual Bill Range
Before solar, this composite household pays around $2,100 to $2,300 a year. After installation, a realistic total bill sits between $800 and $1,100, once you account for fixed fees and nighttime energy purchases in July. That produces net annual savings of roughly $1,100 to $1,400, in line with the calculated $1,296 energy figure. Year-to-year weather will cause some variation, and a dirty array will reduce those savings.
Increasing Self-Consumption to Boost Savings
Shifting when you use electricity can improve the financial return. Raising self-consumption to 70%—by running appliances at noon or pre-cooling the home from 3:00 to 5:00 p.m.—lifts annual energy savings to around $1,332 and further lowers summer bills. Adding a home battery to cover the 6:01–9:00 p.m. peak trims the bill even more, though the battery’s cost has to be factored into your long-term payback period.
Fixed Costs That Print Every Month
Certain items remain on your statement regardless of generation:
- The basic service charge
- Local utility fees and taxes
- Any applicable demand charges
Solar changes your energy usage line, but it does not remove your NV Energy connection. A post-solar bill shows a much smaller usage column rather than a missing statement and planning for $1,200 to $1,500 in annual utility bill reduction is a realistic expectation for this household profile. Review your highest summer bill to see how your usage compares with this baseline.
How NV Energy Net Metering & Demand Charges Affect Savings
The post-solar savings in this case study exist entirely because of how NV Energy measures kilowatt-hours. Those savings can shrink quickly if you ignore peak demand, which appears as a separate line on your bill.
Monthly Netting Under NMR-405
NV Energy compares energy delivered to your home against energy exported back to the grid over your standard monthly billing cycle. A surplus generated on a sunny Tuesday afternoon can offset energy imported from the grid on Friday night within that same cycle. This monthly netting structure allows an 8 kW solar-only array in Las Vegas to deliver strong financial returns without requiring an expensive home battery. You only receive the 75% credit rate on the net surplus remaining at the end of the month. Electricity used directly inside the home avoids retail charges at full value.
Comparing Spring Exports to Summer Imports
Spring production profiles differ significantly from mid-summer demand:
- April (Shoulder Season): High solar irradiance paired with mild spring temperatures and minimal air conditioning loads yields massive net excess generation, building up substantial export credits banked at 75% of retail value to help offset future summer billing spikes.
- July (Peak Summer): Extreme desert heat drives heavy central air conditioning usage that consumes midday solar production instantly as it is generated, leaving the home with minimal self-consumption headroom and forcing grid power imports during high-cost evening window hours.
The result for July is a reduced import bill rather than a full offset funded by spring credits. Export credits also cannot be applied toward the fixed basic service charge, which keeps winter statements at the base fee floor.
The 20-Year Net Metering Lock
Securing an NMR-405 Tier 4 interconnection agreement locks in your net metering terms for 20 years at that specific property. If you sell the home, the agreement transfers to the next owner. As utility retail rates rise over time, a 75% credit applied against a higher base rate produces a larger dollar credit.
Optional Time-of-Use Rates
NV Energy’s Time-of-Use (TOU) schedule has an on-peak window from 6:01 p.m. to 9:00 p.m. daily between June and September. For this household, the air conditioner runs heavily during those exact hours. Putting a solar-only home on TOU can raise the bill because peak rates hit right as solar production drops off. This composite stays on standard flat rates until an energy storage system is added.
Daily Demand Charges
Daily demand charges are based on the highest 15-minute power peak recorded each day, multiplied by a demand rate. Net metering credits cannot be applied toward these fees and running high-draw appliances at the same time around dinner creates daily demand spikes that a solar-only roof cannot offset after sunset. To manage peak demand, stagger heavy appliance use and pre-cool the home before considering battery storage.
Regional Net Metering Differences
Northern Nevada utilities use 15-minute export netting intervals for new residential connections in Reno. Southern Nevada homes in North Las Vegas operate under standard monthly net metering rules. Monthly net metering delivers about $1,300 in annual energy savings for this household. However, unmanaged daily demand spikes or a mismatched TOU rate structure can quickly reduce those gains if you treat the grid as an unlimited buffer during evening hours.
Breakdown of Savings Sources
If you can’t identify exactly where your savings come from, you can’t accurately evaluate your post-solar bill. Real financial returns come from specific, distinct categories.
Category 1: Direct Self-Consumption (~$864/year)
This category covers the 7,200 kWh used at $0.12 per kWh—electricity produced and consumed immediately on-site. Running the air conditioner at noon draws directly from solar generation, so it never needs a 75% export credit from NV Energy. You can increase these savings by shifting major electricity use into peak daylight hours. A home battery effectively moves surplus midday generation to cover evening needs, functioning as extended self-consumption, though it requires additional capital.
Category 2: Net Metering Export Credits (~$432/year)
This category covers the 4,800 kWh credited at the 75% export rate ($0.09 per kWh). Oversizing the array increases export credits, but every additional kilowatt-hour sent to the grid is valued at that reduced rate. Export credits are a partial offset, not a full retail buyback.
Category 3: Property Tax Exemption (~$100–$250/year)
Under NRS 361.079, Nevada provides a property tax exemption on the added value a solar system brings to a home. This benefit reduces your county property tax bill rather than appearing as a credit on your NV Energy statement.
Categories Worth $0 in 2026 (Owned Systems)
- Section 25D federal residential tax credit
- NV Energy rooftop rebate programs
- State income tax credits
- Basic customer service charge savings
- Renewable Energy Tax Abatements (RETA) or Solar Renewable Energy Certificates (SRECs)
Factors That Can Reduce Savings
- Unmanaged Time-of-Use (TOU) rates applied during peak 6:01–9:00 p.m. cooling hours
- Active demand charges that cannot be offset using net metering credits
- Solar loan interest costs that exceed simple system energy savings
- High ambient temperatures on west-facing walls that cause inverter derating and lower total generation
Calculating Total Return
Combining direct energy savings gives $864 (self-consumed) + $432 (exported) = $1,296 a year in reduced electricity costs. Adding an estimated $180 property tax benefit brings the total financial value to about $1,476 per year and against a $22,000 net system cost, that produces a simple payback period of roughly 15 years. Compared with an initial annual utility spend of about $2,200, the home continues to pay between $800 and $1,100 a year for fixed fees and grid imports.

Lessons Learned & Tips for Maximum Savings
A solar setup only beats its pre-solar energy costs if the household learns to treat midday as the cheapest time of day.
Run Your House When Solar Generation Peaks
To maximize savings, run energy-intensive appliances when the array is producing the most—typically between late morning and mid-afternoon. Schedule the dishwasher, washing machine, pool pump, and EV charging during those peak sun hours. Pre-cooling the home from 3:00 to 5:00 p.m. also reduces the load on your 4-ton air conditioner when temperatures peak around 6:20 p.m. These shifts raise self-consumption from 60% to 70% and increase direct energy savings without adding more panels.
Avoid Optional Time-of-Use Rates Without Storage
NV Energy’s Time-of-Use (TOU) schedule has an on-peak window from 6:01 p.m. to 9:00 p.m., which lines up with peak residential air-conditioning demand. Putting a solar-only system on TOU can raise summer bills because generation drops off right as the higher rates take effect. Homeowners should add battery storage before switching to a TOU rate plan.
Install Inverters in Shaded Locations
Mounting inverters on north-facing or shaded walls protects equipment from thermal stress. Installing an inverter on an unshaded western wall exposed to 4:00 p.m. summer temperatures can cause thermal derating, reducing afternoon power conversion when electricity demand remains high.
Avoid Oversizing Systems to Offset Summer Demand
Adding extra solar capacity beyond midday household use creates more net metering exports, which are credited at the reduced 75% rate. If summer utility bills stay high, load shifting or battery storage is usually a more cost-effective fix than overbuilding the array.
Manage Daily Peak Demand Spikes
To prepare for daily demand charges, avoid running high-draw appliances—such as an electric dryer—at the same time as the central air conditioner. Net metering credits cannot offset demand charges, so staggering those loads is essential for keeping peak demand fees down.
Thank you for reading! If you have any feedback or a specific Nevada solar topic you’d like us to cover next, please reach out directly at admin@nevadasolarguide.com.